
After the major problem of youth crime in Llandudno I thought I would look up some statistics.
It would be nice to go back every decade from the II World War to date and look at what the patterns are.
If you see this please let us know. Many thanks as always.
But when you read all of this you can soon learn that things are getting worse, much worse.
The youth justice system in England and Wales works to prevent offending and reoffending by children. The youth justice system is different to the adult system and is structured to address the needs of children.
This publication looks at the youth justice system in England and Wales for the year ending March 2022. It considers the number of children (those aged 10 to 17) in the system, the offences they committed, the outcomes they received, their demographics and the trends over time.
Main points
| 13,800 children were cautioned or sentenced | ↓ | The number of children who received a caution or sentence has fallen by 13% in the last year with a 79% fall over the last ten years. |
| 8,000 first time entrants to the youth justice system | ↓ | The number of first time entrants has fallen by 10% since the previous year, with a 78% fall from the year ending March 2012. |
| 3,500 knife and offensive weapon offences were committed by children | ↓ | There was a 2% decrease in these offences compared with the previous year. Levels are 3% lower than those seen in the year ending March 2012. |
| Almost three quarters of children remanded to custody received a non-custodial outcome | = | Of those remanded in custody who received a non-custodial sentence, just under half were acquitted or had their case dismissed while just over half received a non-custodial sentence. |
| The average time from offence to completion at court remained high | ↓ | The average time from offence to completion was 217 days, down slightly from 221 days in the previous year but well above pre-pandemic levels. It was 121% higher (or 119 days longer) than the year ending March 2012. |
| The average custodial sentence length increased by six months | ↑ | The average custodial sentence length increased by six months compared with the previous year to 22.8 months. This increase may have been due to a small number of cases which impacted on the overall average. |
| The number of children held in custody has fallen | ↓ | There was an average of around 450 children in custody at any one time during the year. This is a fall of 19% fall against the previous year and a 77% fall against the year ending March 2012. |
| All custodial Behaviour Management measures saw increases in rates | ↑ | Compared with the previous year, rates of separation increased by 56%, assaults by 25%, self harm by 29% and Restrictive Physical Interventions by 17%. The rises are likely due to a return to normal regimes compared with the previous year during periods of COVID-19 restrictions. |
| 31.2% of children and young people reoffended | ↓ | The reoffending rate decreased by three percentage points in the last year and is the lowest on record but is likely to have been impacted by periods of restrictions during the first year of the COVID-19 pandemic. |
For technical details see the accompanying Guide to Youth Justice Statistics
We would welcome any feedback to statistics@yjb.gov.uk
Things you need to know
This publication draws together a range of statistics about children and young people in the YJS from 1 April 2021 to 31 March 2022 (hereafter the year ending March 2022), where available. Following on from the recommendations in the Overcoming Barriers to Trust in Crime Statistics report, this publication guides the user through the flow of children aged 10 to 17 years in the justice system in England and Wales.
The contents of the report will be of interest to government policy makers and those monitoring policy, the agencies engaged with the youth justice system at both national and local levels, academics, the voluntary and community sector and others who want to understand more about the system.
The data described in this publication come from various sources including the Home Office, the Ministry of Justice (MoJ), Youth Custody Service (YCS), Youth Justice Services (YJSs) and youth secure estate providers. The Statistics and Analysis Team at the Youth Justice Board for England and Wales (YJB) produce this report.
Details of all the administrative databases and bespoke collections used for this report can be found in the Guide to Youth Justice Statistics which provides users with further information on the data sources, data quality and terminology, in particular the types of outcomes given to children. Where data are taken from other publications, links can be found within the chapters.
This is an annual report, with the focus on the year ending March 2022, however much of the data used in this report are drawn from quarterly publications and there may be more up to date data available. The purpose of this report is to provide an overall summary of the youth justice system, allowing users to find everything in one place. All data referenced are available in the Supplementary Tables that accompany this report. Separate tables covering YJS level information are also available in an open and accessible format.
Within this publication the words ‘child’ or ‘children’ are used to describe those aged 10 to 17. When the terms ‘child or young person’ or ‘children and young people’ are used, it means that 18 year olds may be included in the data. For example, in the reoffending dataset, someone who entered the cohort aged 17 and subsequently reoffended aged 18 will be included.
Rounding conventions have been adopted in this publication to aid interpretation and comparisons. Figures greater than 1,000 have been rounded to the nearest 100 and those smaller than 1,000 to the nearest 10. Rates have been reported to one decimal place. Percentages have been calculated from unrounded figures and then rounded to the nearest whole percentage. Unrounded figures have been presented in the Supplementary Tables.
The data in this report are compared with the previous year (the year ending March 2021 in most cases), with the year ending March 2012 as a long-term comparator (ten years). Where a ten year comparator is not available, the year ending March 2017 has been used (five year comparator). Any other reference period is referred to explicitly.
Statistician’s comment
This publication draws together a range of statistics about children in the youth justice system. The latest figures highlight the continuing impact of the COVID-19 pandemic on the youth justice system in some areas as well as a continuation of downward trends in others.
The average custodial sentence length increased by six months which may have been affected by a small number of cases which can cause fluctuations in the average custodial sentence length. The average number of days from offence to completion at court remained very high at 217 days, falling by just four days compared with the previous year and well above pre-pandemic levels. The proportion of children in custody on remand increased compared with the previous year to 45% which is likely to have been impacted by the timeliness of offence to completion at court.
In the youth secure estate, behaviour management rates returned to pre-pandemic levels or increased, such as rates of restrictive physical intervention, self harm and assaults in custody following a return to normal regimes in the youth secure estate.
While continuing to be overrepresented across most stages of the youth justice system, there were reductions in the proportions of Black children across several areas including stop and search, arrests, youth cautions, first time entrants, sentencing and children in custody.
Proven reoffending rates have reduced to the lowest on record. While there has been a downward trend in recent years, the latest figure is likely to have been impacted by the impacts of court closures and pauses to jury trials during the periods of restrictions in the first year of the COVID-19 pandemic.
1. Gateway to the youth justice system
In the year ending March 2022:
There were around 94,900 stop and searches of children, an 18% reduction on the previous year.
Black children were involved in 16% of stop and searches (where ethnicity was known). This was a decrease of two percentage points from the previous year, but 12 percentage points higher than the proportion of Black 10 to 17 year olds in the 2011 population.
The majority (78%) of stop and searches of 10 to 17 year olds resulted in No Further Action, while 9% resulted in arrest.
Arrests of children increased by 7% compared to the previous year to around 53,000[footnote 1], though there were decreases in the number of arrests of Asian or Other and Black children of 16% and 12% respectively.
This chapter covers data on stop and searches, arrests and youth cautions given to children.
1.1 Stop and searches of children aged 10 to 17
There were around 94,900 stop and searches of children, an 18% reduction on the previous year. The Police Powers and Procedures: Stop and Search publication, from which these data are sourced, states that the higher number for the year ending March 2021 can be partly attributed to proactive policing during the COVID-19 lockdown periods.
Figure 1.1:Number of stop and searches of children by ethnicity as a proportion of total where ethnicity is known[footnote 2], England and Wales, years ending March 2021 to 2022
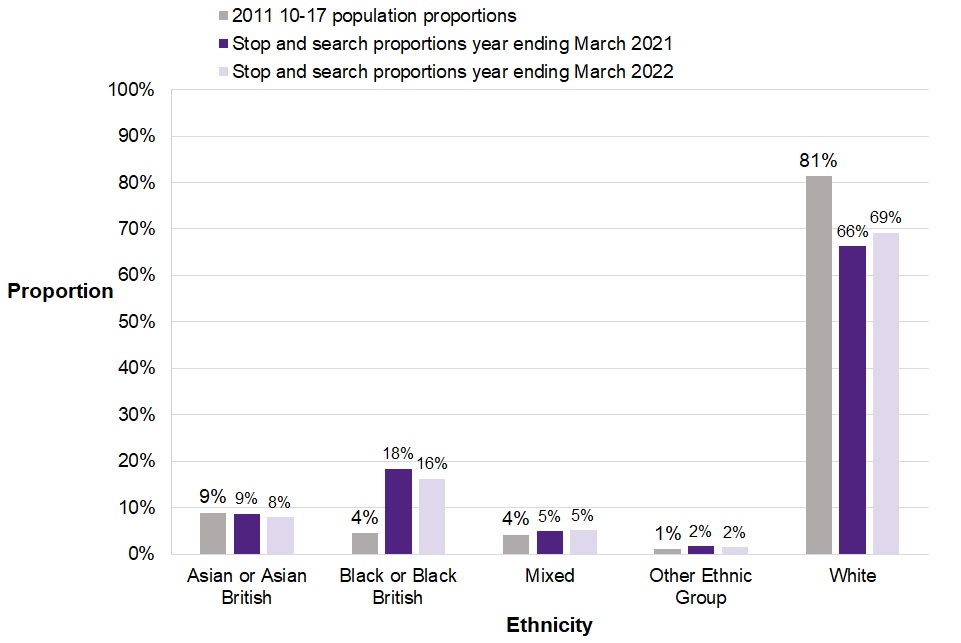
Figure 1.1 shows that Black children were involved in 16% of stop and searches (where ethnicity was known). This was a decrease of two percentage points from the year ending March 2021, but 12 percentage points higher than the proportion of Black 10 to 17 year olds in the 2011 population. There was an increase of three percentage points in the proportion of White children involved in a stop and search compared with the previous year (66% in the year ending March 2021 compared with 69% in the latest year), the only ethnic group to see an increase.
Around 93,600 (99%) stop and searches were carried out under Section 1 of the Police and Criminal Evidence Act (PACE) 1984 which provides police with the power to stop and search a person or vehicle where they have reasonable grounds that they will find prohibited items including offensive weapons or drugs.
The remaining 1,300 (1%) of stop and searches were carried out under section 60 of the Criminal Justice and Public Order Act of 1994, which gives police the right to search people in a defined area during a specific time period after serious violence has taken place or when police believe that serious violence will take place.
Figure 1.2: Number and proportion[footnote 3] of stop and searches by outcome type, England and Wales, year ending March 2022
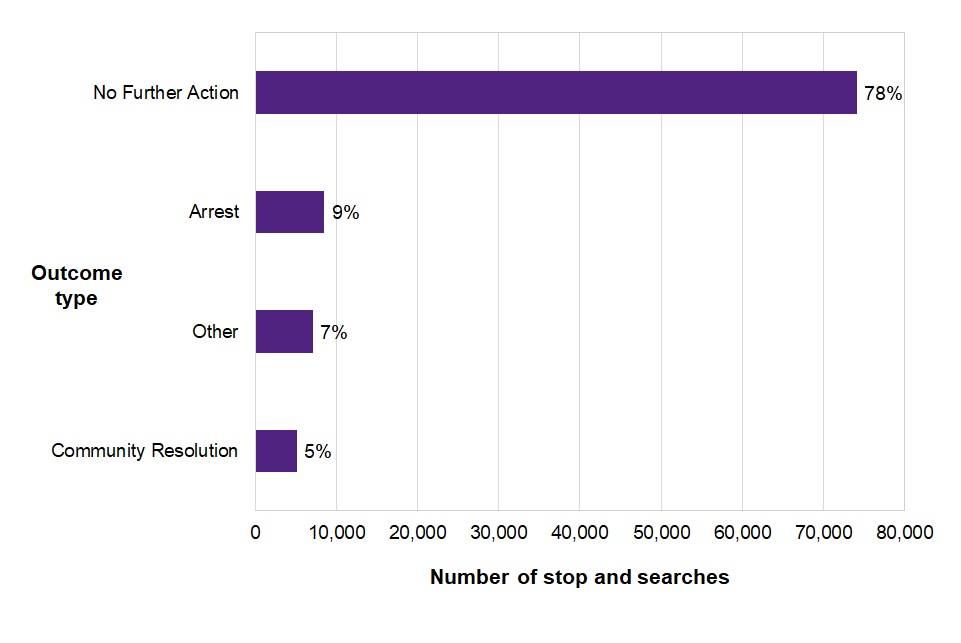
As figure 1.2 shows, the majority (around 74,200 or 78%) of stop and searches of 10 to 17 year olds resulted in No Further Action, while around 8,500 (9%) resulted in arrest, 5,100 (5%) resulted in Community Resolutions and the remaining 7,100 (7%) resulting in other outcomes including Cannabis Warnings, Seizure of Property or Verbal Warnings.
1.2 Arrests of children for notifiable offences
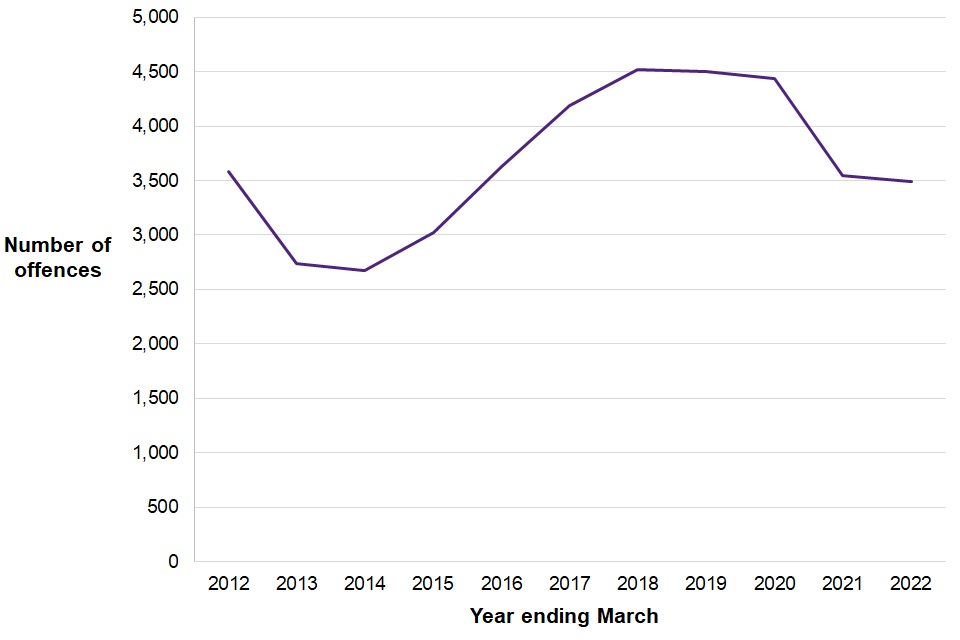
Figure 1.3: Trends in arrests of children for notifiable offences[footnote 4], England and Wales, years ending March 2012 to 2022
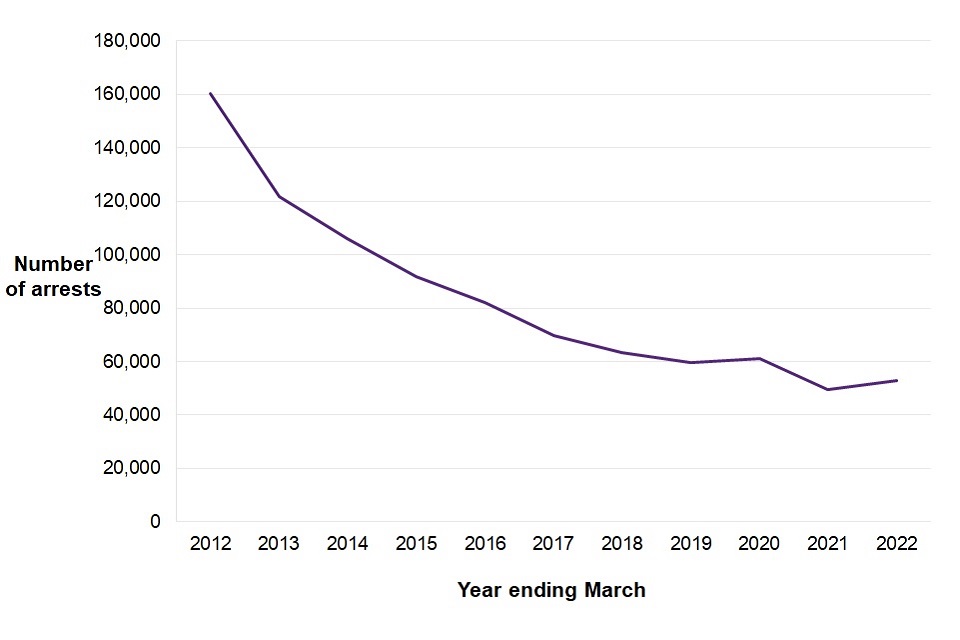
In the latest year, there were just under 53,000 arrests of children (aged 10 to 17) for notifiable offences. This was an increase of 7% compared to the year ending March 2021, which saw the lowest number of arrests of children since the time series began and was likely to be driven in part by the periods of restrictions during the COVID-19 pandemic.
1.3 Arrests of children by offence group
Figure 1.4: Percentage change in arrests by offence group, England and Wales, years ending March 2021 to 2022
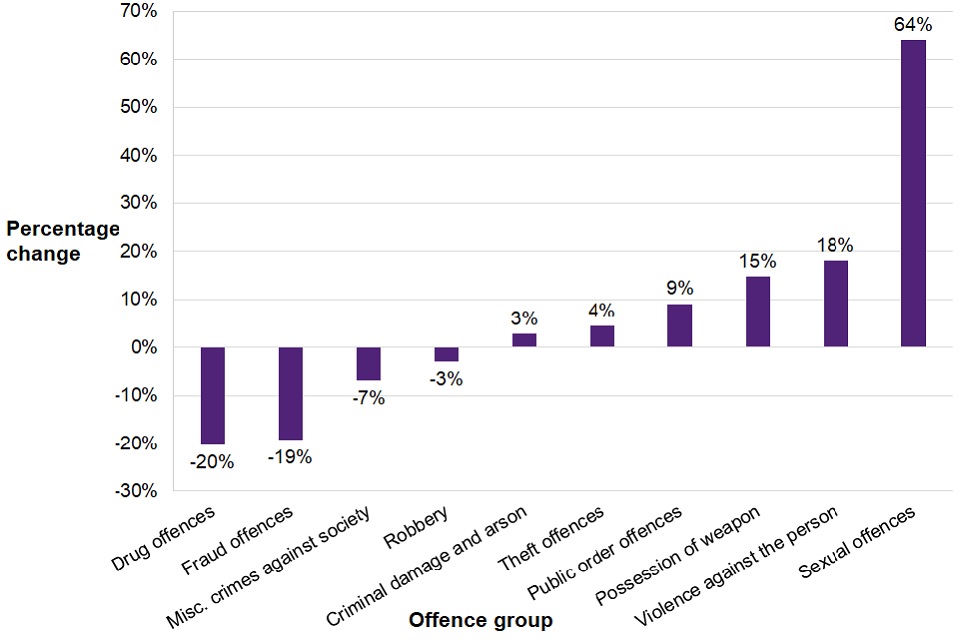
Figure 1.4 shows the year on year percentage change in the number of arrests by offence group. Sexual offences saw the biggest rise with a 64% increase on the previous year (from around 1,700 to around 2,900). This was followed by smaller rises for arrests for violence against the person offences and possession of weapons offences which increased by 18% and 15% respectively. Arrests for drugs offences and fraud offences saw the biggest decreases falling by 20% and 19% year on year respectively.
1.4 Arrests of children by ethnicity
Figure 1.5: Arrests of children for notifiable offences by ethnicity as a proportion of total arrests of children, England and Wales, years ending March 2012 to 2022
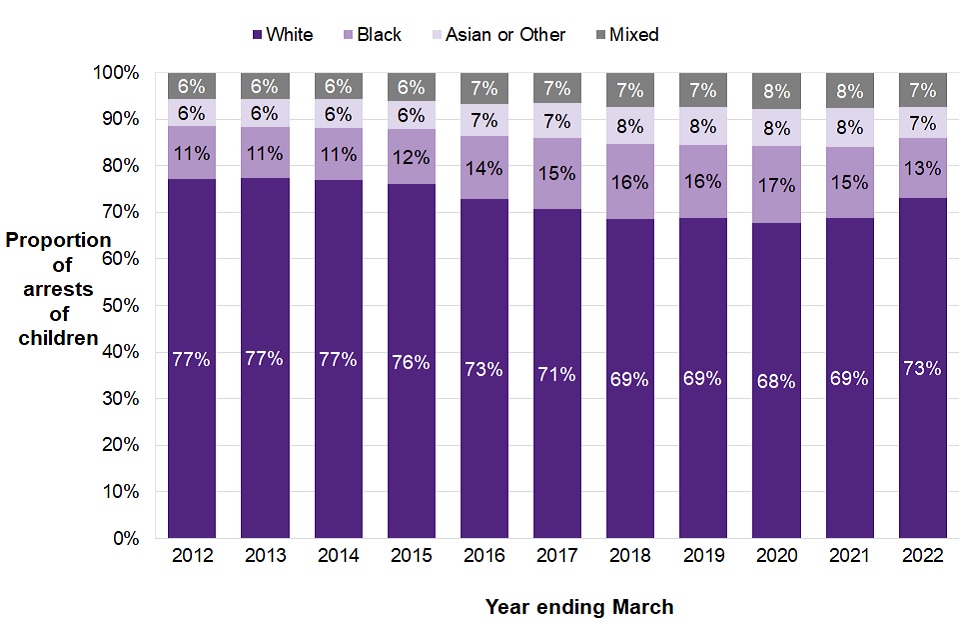
In the latest year, 73% (around 33,300) of arrests were of White children. This proportion is a decrease from 77% in the year ending March 2012, though an increase from 69% in the previous year. Arrests of Black children accounted for 13% (around 5,800) of arrests in the latest year, two percentage points higher than the proportion ten years ago but two percentage points lower than the previous year and four percentage points lower than the year ending March 2020. Arrests of Mixed (around 3,300) and Asian and Other (around 3,100) children both made up 7% of the total in the latest year and have also seen changes in proportions over the last ten years, albeit on a smaller scale.
Compared with the year ending March 2012, the numbers of arrests of children of each ethnicity have all decreased by a large degree, but at different rates. For example, arrests of White children have fallen by 73%, compared to 67% for Black children. This has led to a change in the proportions of arrests by ethnicity.
Compared with the previous year, there was an 11% increase in the number of arrests of White children, while there was a decrease of 16% of arrests of Asian or Other children, and a decrease of 12% in the number of arrests of Black children.
1.5 Youth cautions[footnote 5]
Figure 1.6: Trends in youth cautions given to children, England and Wales, years ending March 2012 to 2022
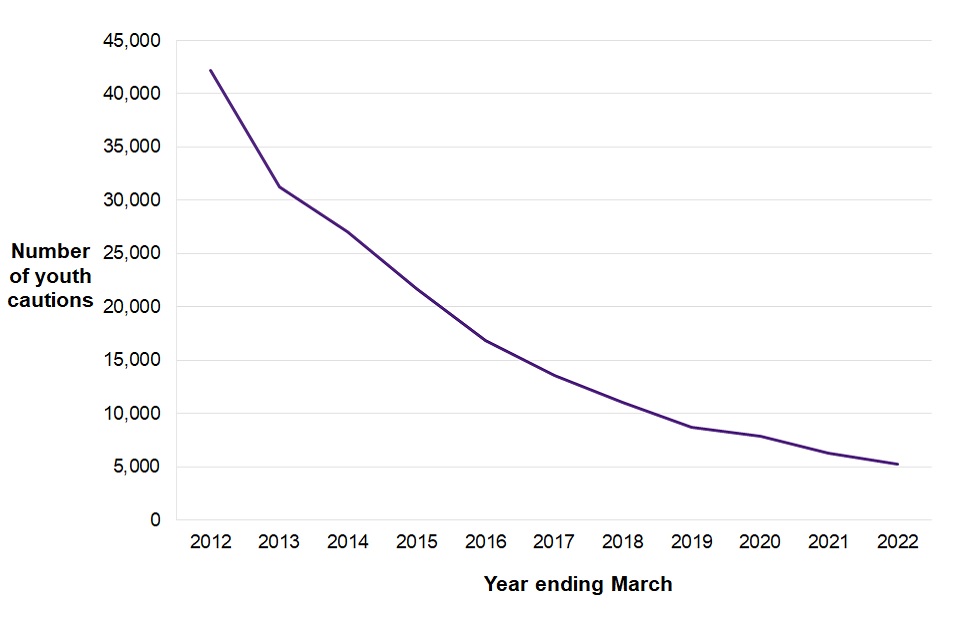
In the year ending March 2022, around 5,300 youth cautions were given to children. This is a decrease of 88% since the year ending March 2012, with a decrease of 16% compared with the previous year.
Youth cautions increased by 2% for both violence against the person and public order offences compared with the previous year, while there were either decreases or no change in youth cautions given for all other offence types (Supplementary Table 1.16).
Figure 1.7: Number of youth cautions by ethnicity[footnote 6] as a proportion of total given, England and Wales, years ending March 2012 to 2022
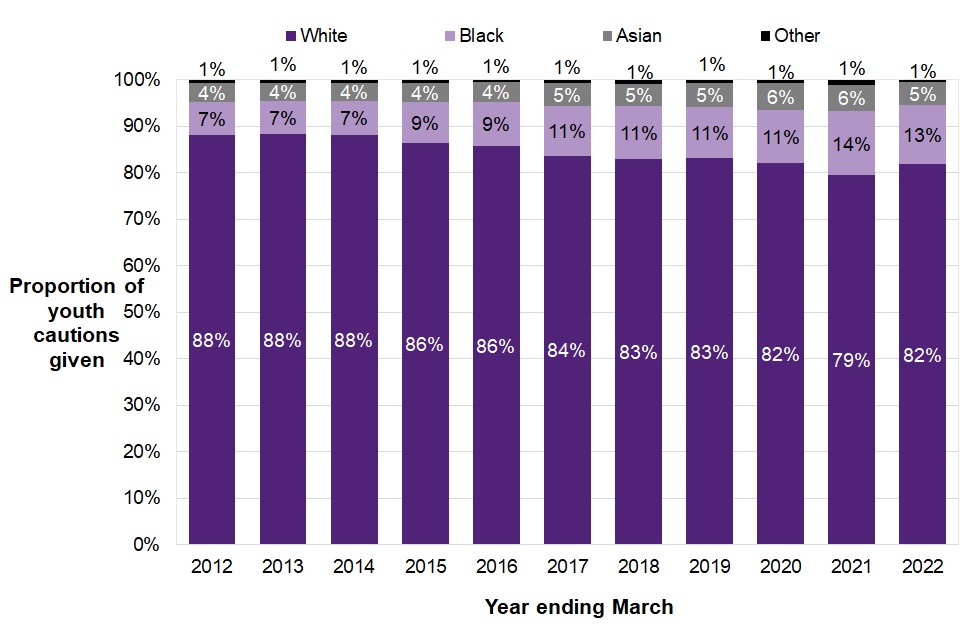
In the latest year, the proportions of youth cautions issued have decreased for Black children and increased for White children, while remaining broadly stable for Asian and Other children. All ethnic groups have seen decreases in the volume of youth cautions issued over the course of the decade. However, there was a smaller decrease for Black children when compared to other ethnic groups, leading to an increase in the proportion of youth cautions Black children made of the total, from 7% to 13% over the last decade.
Figure 1.8: Trends in numbers and proportions of youth cautions given by type, England and Wales, years ending March 2020 to 2022

For the first time, the Ministry of Justice has made available youth caution data by type, covering the last three years. Figure 1.8 shows that conditional cautions are higher than simple cautions in the latest year with an increase of four percentage points compared with the previous year.
2. First time entrants to the youth justice system
In the year ending March 2022:
There were around 8,000 child first time entrants (FTEs) to the youth Justice system. The number of child FTEs has continued to fall, as it has done in each of the last ten years, with a 10% decrease since the previous year and a 78% decrease since the year ending March 2012.
There were increases for child FTEs committing summary motoring offences (up 13%), violence against the person and public order offences (both up 2%) compared with the previous year. All other offence types committed by child FTEs decreased, with drug offences and robbery seeing the biggest decreases (falling by 31% and 29% respectively).
While all ethnicities saw a decrease in the number of child FTEs compared with the previous year, those from a Black background saw the biggest fall (24%), whilst child FTEs from a White background saw the smallest year on year decrease (10%).
This chapter covers data and trends on trends, demographics, offence and outcome types of child first time entrants. A first time entrant to the youth justice system is a child aged between 10 and 17 who received their first caution or court sentence.
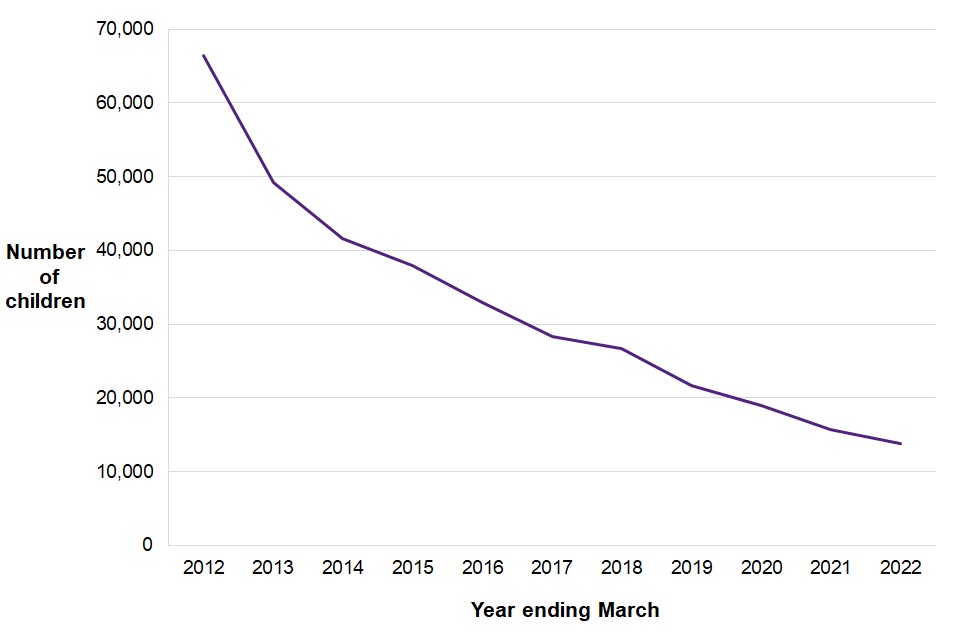
2.1 Trends in the number and proportion of child first time entrants to the youth justice system
Figure 2.1: Child first time entrants, England and Wales, years ending March 2012 to 2022
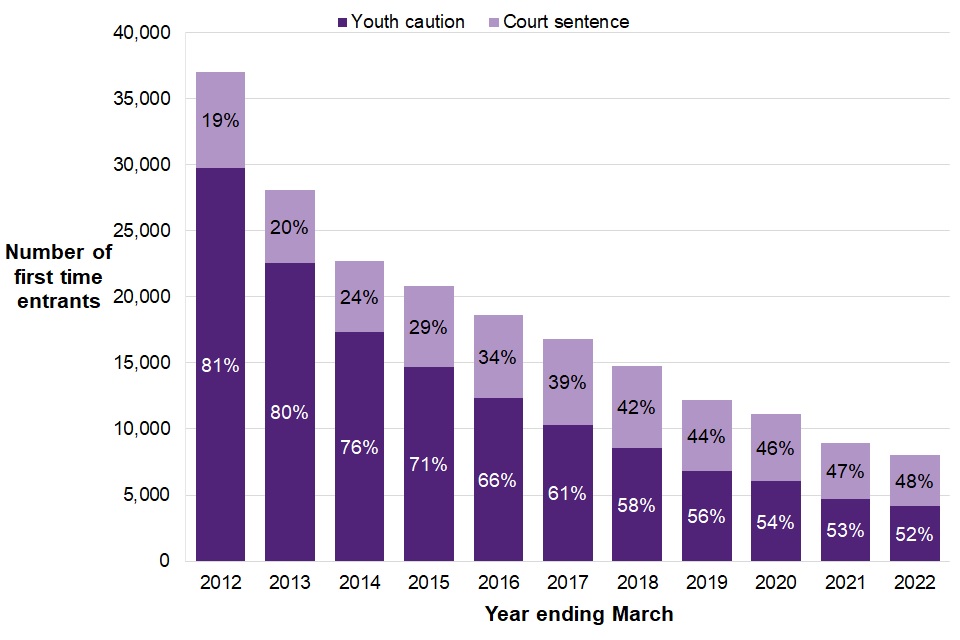
The number of child FTEs to the youth justice system (aged 10 to 17) has continued to fall. Compared with the previous year, the number fell by 10% (from around 8,900) to just over 8,000. Compared with the year ending March 2012, the number has fallen by 78% (from around 37,000).
Children accounted for 9% of all FTEs to the criminal justice system in the year ending March 2022, compared to 18% in the year ending March 2012 (see Chapter 11 – Comparisons with the Adult System) and down from 11% in the previous year.
As shown in Figure 2.1, the difference between the number of child FTEs receiving a caution as opposed to a court sentence is much smaller in recent years compared with ten years ago. While the majority of child FTEs received a caution in each of the last ten years, this proportion has fallen from 81% in the year ending March 2012 (when around 29,800 child FTEs received a caution), to 52% in the year ending March 2022 (when just under 4,200 child FTEs received a caution). Though youth cautions and court sentences have both been decreasing in this period, youth cautions fell at a faster rate.
The number of child FTEs receiving a court sentence (predominantly community sentences) had been falling year-on-year from the year ending March 2012 to March 2015 and rising thereafter before falling again in year ending March 2018. Since the year ending March 2012, the proportion of child FTEs receiving a sentence has increased from 19% to 48%.
2.2 Characteristics of child first time entrants
Figure 2.2: Demographic characteristics[footnote 7] of child first time entrants compared to the general 10 to 17 population[footnote 8], England and Wales, year ending March 2022
| Aged 10 to 14 | Aged 15 to 17 | Boys | Girls | |
| FTEs | 27% | 73% | 85% | 15% |
| 10 to 17 population | 64% | 36% | 51% | 49% |
Age
The average age of FTEs has increased compared with ten years ago [footnote 9]. It increased from 15.1 years old in the year ending March 2012 to 15.4 in the latest year. Over the last ten years, the average age of child FTEs receiving a sentence has always been higher than the average age of those receiving a youth caution (Supplementary Table 2.8).
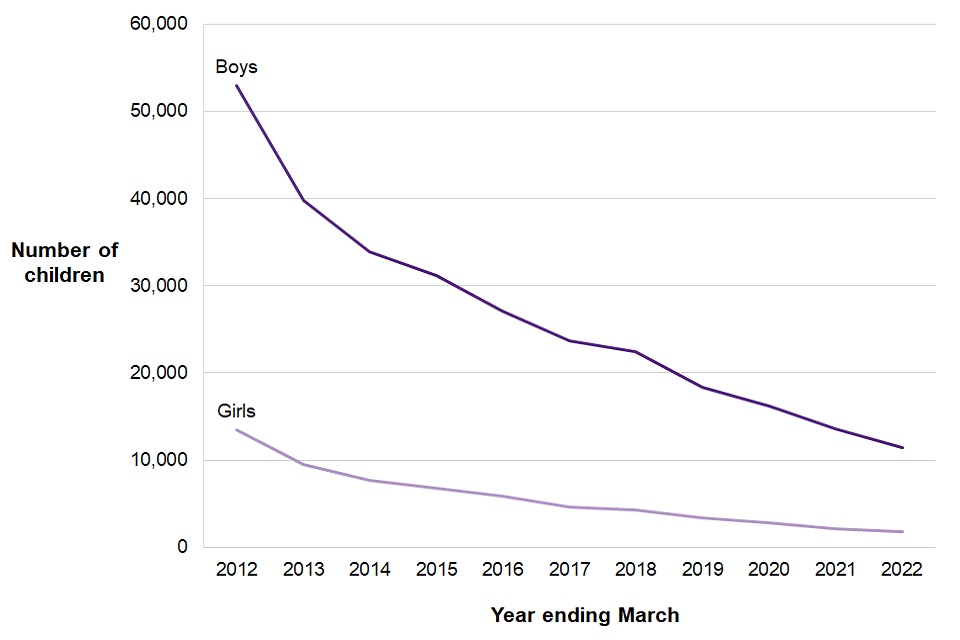
Sex
There have always been more boys than girls who are child FTEs. In the year ending March 2022, boys comprised 85% of the total child FTEs, whilst making up 51% of the general 10 to 17-year-old population.
The number of child FTEs has fallen for both boys and girls over the last decade, with the larger percentage decrease seen in girls. The number of child FTEs who are girls has fallen by 87% (from around 9,400 to around 1,200) over the last ten years. This compares to a decrease of 76% for child FTEs who are boys over the same period (from around 27,400 to around 6,700). In the latest year, for the first time in the time series, there was a greater year on year percentage decrease in the number of child FTEs who were boys than child FTEs who were girls, an 11% fall in child FTEs who are boys compared to a 6% decrease in girls (Supplementary Table 2.6).
Figure 2.3: Number of child first time entrants by ethnicity, England and Wales, years ending March 2012 to 2022
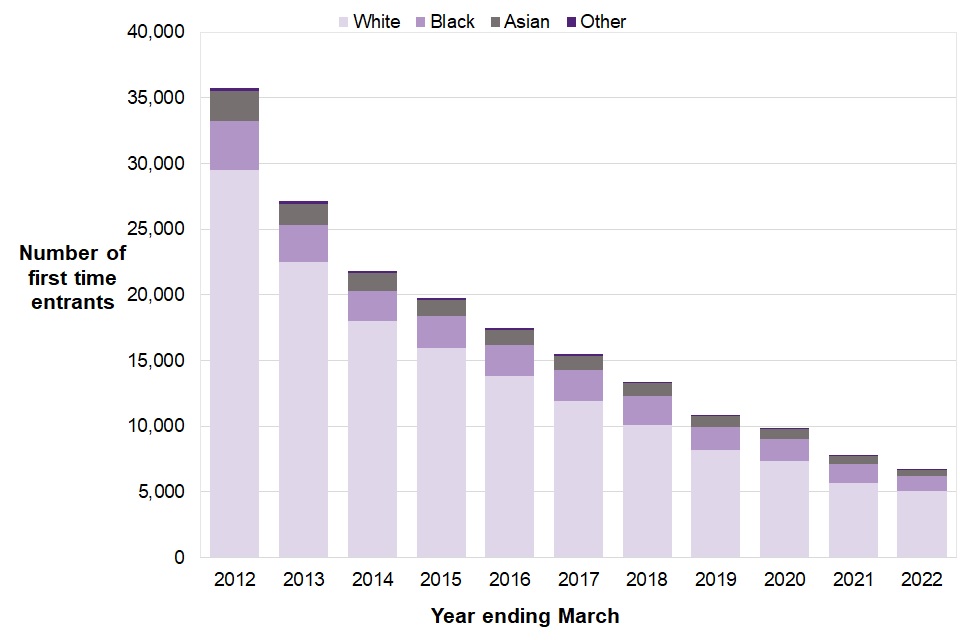
Ethnicity
As shown in Figure 2.3, the number of child FTEs has been falling for each ethnicity over the last ten years (except for FTEs from a Black ethnic background in which there was a small increase between the years ending March 2014 to 2015 and March 2016 to 2017). Child FTEs from a White ethnic background have fallen at the fastest rate, by 83% over the last ten years, resulting in the proportion[footnote 10]they comprise of all child FTEs reducing from 82% to 75%.
While all ethnicities saw a decrease in the number of child FTEs compared with the previous year, those from a Black background saw the biggest fall (24%), whilst child FTEs from a White background saw the smallest year on year decrease (10%).
The proportion of child FTEs from a Black background has decreased from 18% to 16% in the most recent year but remains higher than the 10% seen ten years ago. The proportion of child FTEs from an ethnic minority background has decreased to 25% in the year ending March 2022, compared to 27% last year.
2.3 Types of offences committed by child first time entrants
In the year ending March 2022, the two most common offences committed by child FTEs were summary offences excluding motoring and possession of weapon offences. These offence types both accounted for 21% of all offences committed by child FTEs. Compared with the year ending March 2012, the proportion of theft offences fell from 27% to 9%.
The proportion of child FTEs committing possession of weapon offences increased by 17 percentage points over the last ten years and is the only offence group to see a real term increase in that period.
Figure 2.4: Number and proportion of offences committed by child first time entrants by offence group, England and Wales, years ending March 2012, 2021 and 2022
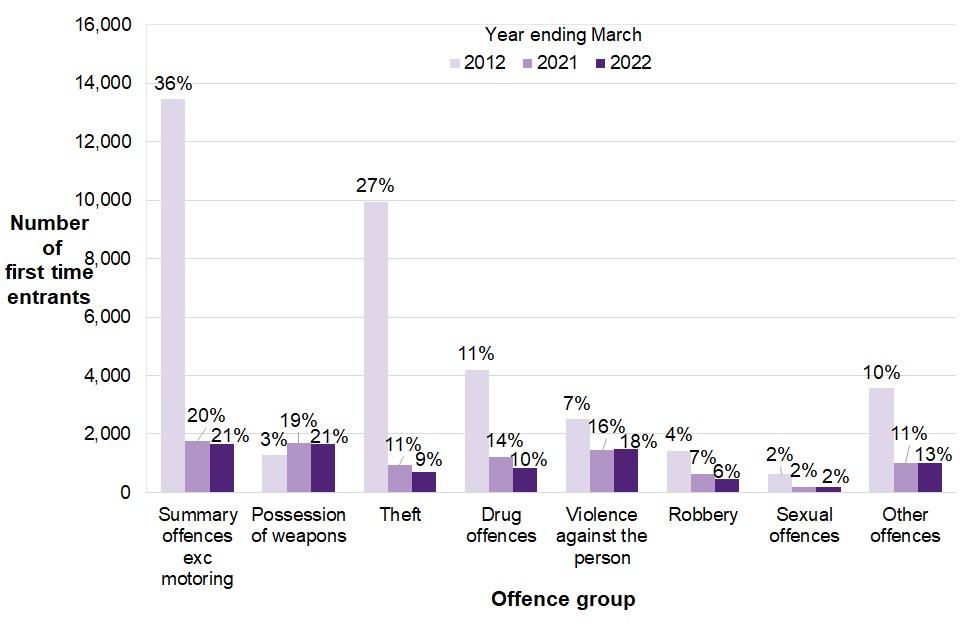
Supplementary Table 2.2 shows that in the year ending March 2022 there was an increase in the number of offences for summary motoring offences (up 13%), violence against the person and public order offences (both up 2%) for child FTEs compared to last year. All other offence groups saw a decrease.
Compared with ten years ago, all offences for child FTEs saw a real term decrease with the exception of possession of weapons offences which increased by 30%, however the proportion these offences make up have changed over time.
The offence groups for child FTEs that have seen the largest percentage point increases compared with ten years ago are:
Possession of weapons offences, increasing by 17 percentage points, to 21% of total;
Violence against the person, increasing by 12 percentage points to 18% of total;
The offence groups for child FTEs that have seen the largest percentage point decreases compared with ten years ago are:
Theft offences, decreasing by 18 percentage points to 9% of total; and
- Summary offences excluding motoring, decreasing 16 percentage points to 21% of total.
3. Demographic characteristics of children cautioned or sentenced
In the year ending March 2022:
Around 13,800 children received a caution or sentence, a fall of 13% compared with the previous year and a fall of 79% compared to ten years ago.
The proportion of Black children cautioned or sentenced has remained stable at 12% for the third successive year but is four percentage points higher than it was in the year ending March 2012 (12% compared to 8%).
All ethnic groups saw decreases in the number of children cautioned or sentenced compared to the previous year, with Asian children seeing the biggest fall of 22%, followed by Black children, decreasing by 16%. Mixed children cautioned or sentenced saw the smallest decrease (9%).
The number of children cautioned or sentenced in both the 10 to 14 year old and 15 to 17 year old ages groups decreased by 1% and 15% respectively.
This chapter looks at the trends and demographic characteristics of children who received at least one youth caution or court sentence.
3.1 Number of children who received a caution or sentence
Figure 3.1: Number of children given a caution or sentence, England and Wales, years ending March 2012 to 2022
Around 13,800 children received a caution or sentence in the year ending March 2022. There have been year-on-year falls in each of the last ten years, and in the latest year, 13% fewer children received a caution or sentence than the previous year.
There was a 79% decrease in the number of children who received a caution or sentence compared with ten years ago.
3.2 Demographic characteristics of children who received a caution or sentence
Figure 3.2: Age group and sex of children receiving a caution or sentence compared to the general 10 to 17 population, England and Wales, year ending March 2022
| Age 10 to 14 | Age 15 to 17 | Boys | Girls | |
| Children receiving a caution or sentence | 20% | 80% | 86% | 14% |
| 10 to 17 population | 64% | 36% | 51% | 49% |
Children aged 15 to 17 made up 80% of the offending population, while making up 36% of the 10 to 17 population in England and Wales.
Boys made up 86% of the offending population compared with 51% of the 10 to 17 population in England and Wales.
Figure 3.3: Number of children receiving a caution or sentence by sex[footnote 11], England and Wales, years ending March 2012 to 2022
In the year ending March 2022, around 1,800 girls and around 11,500 boys received a caution or sentence, a decrease of 14% and 16% respectively. The number of girls as a proportion of the total number of children who received a caution or sentence is 14%, and the number of boys is 86%. This compares to 13% and 87% respectively in the previous year.
Compared with the year ending March 2012, the numbers of girls and boys receiving a caution or sentence have fallen by 87% and 78% respectively.
Figure 3.4: Number of children receiving a caution or sentence by age, England and Wales, years ending March 2012 to 2022
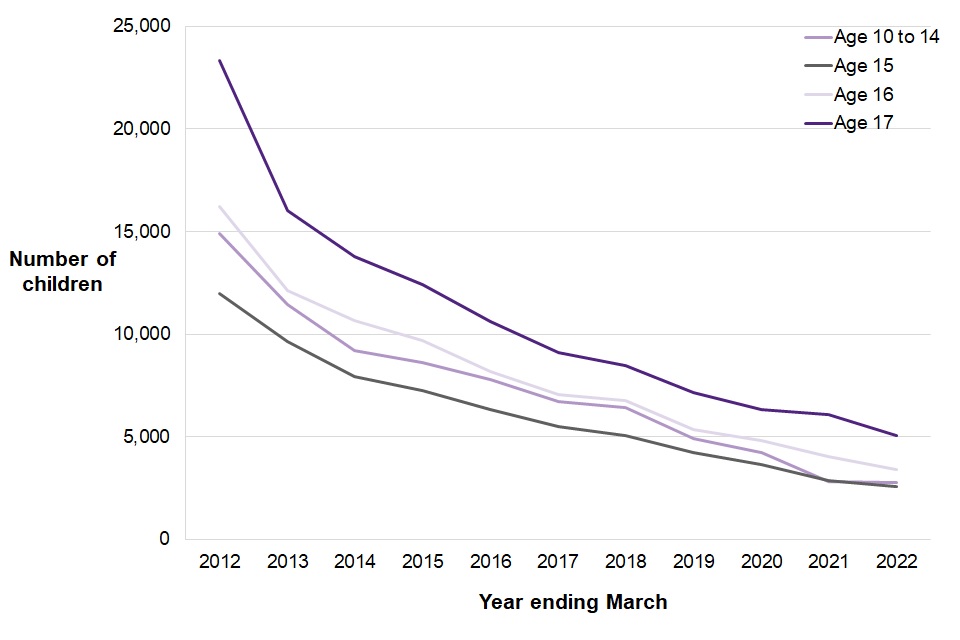
In the year ending March 2022, the number of 10 to 14 year olds cautioned or sentenced decreased by 1% compared with the previous year, while there was a 15% decrease for 15 to 17 year olds.
The proportions which each age comprises of the overall number of children receiving cautions and sentences have remained broadly stable over this period.
Figure 3.5: Proportion of children receiving a caution or sentence by ethnicity[footnote 12], England and Wales, years ending March 2012 to 2022
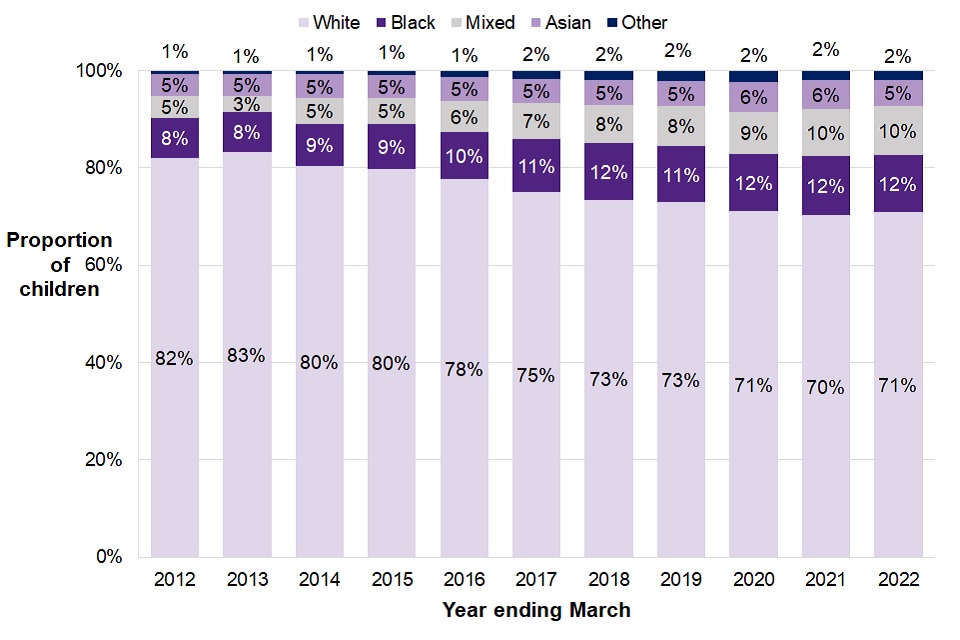
Supplementary Table 3.1 shows that the number of children cautioned or sentenced has varied by ethnicity over the last ten years. This has led to changes in the proportions each ethnic group make up of all cautions and sentences.
Figure 3.5 and supplementary table 3.1 show that:
At 12%, the proportion of Black children cautioned or sentenced is four percentage points higher than it was in the year ending March 2012 , a figure that has been stable at for the last three years.; and
Children from a Mixed ethnic background accounted for 10% of those receiving a caution or sentence in the latest year, the proportion doubling since the year ending March 2012 when it was 5%.
4. Proven offences by children
In the year ending March 2022:
The number of proven offences committed by children fell by 14% from the previous year to around 33,000, the lowest number of proven offences in the time series.
Acquisitive offences[footnote 13]saw the biggest year on year decreases of all offence types with burglary, theft and robbery falling by 32%, 24% and 22% respectively.
While the number of violence against the person offences has followed an overall downward trend, this offence group has been steadily increasing as a proportion of all offences over the last ten years, and now accounts for 35% of all proven offences.
There were just under 3,500 knife or offensive weapon offences resulting in a caution or sentence committed by children. This is a fall of 2% compared with the previous year.
This chapter looks at the trends of proven offences committed by children and proven knife and offensive weapon offences. A proven offence is one which results in a caution or court sentence.
4.1 Trends in proven offences by children
Figure 4.1: Number of proven offences by children, England and Wales, years ending March 2012 to 2022
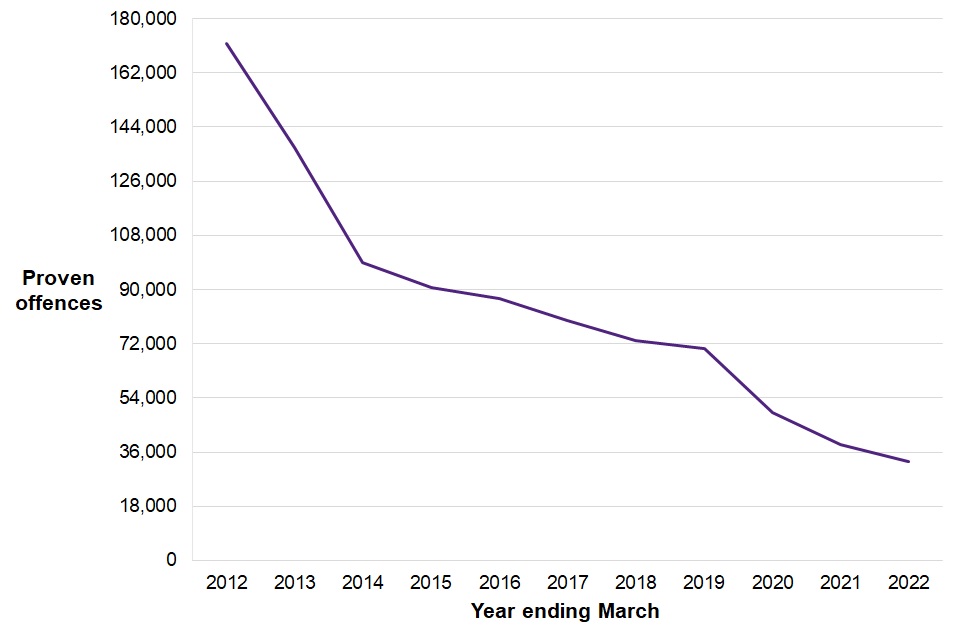
The number of proven offences committed by children has continued to fall. In the year ending March 2022, there were around 33,000 proven offences committed by children which resulted in a caution or sentence in court. This was the lowest number in the time series and a fall of 14% from the previous year and a fall of 81% since the year ending March 2012.
As Figure 4.1 shows, there were larger falls in the number of proven offences committed by children between the years ending March 2012 and 2014, with more modest decreases since then.
Offence volumes
Supplementary Table 4.1 shows that in the last ten years, the number of proven offences has fallen across all offence groups. Theft, burglary and breach of statutory order are the three offence groups to see the largest fall over this time (with theft decreasing by 92% and burglary and breach of statutory order both falling by 89%).
Compared with the previous year, while all offence types saw a decrease, acquisitive offences saw the biggest year on year falls with burglary, theft and robbery falling by 32%, 24% and 22% respectively. Sexual offences had the smallest decrease, falling by 2% compared with the previous year.
Supplementary Table 4.3 shows that in the year ending March 2022, most proven offences were committed by children who were[footnote 14] :
boys (86% of proven offences),
aged 15 to 17 (83% of proven offences); and
White (72% of proven offences).
Offence volumes as a proportion of total
Figure 4.2: Percentage point change in the proportion of proven offences committed by children, England and Wales, between the years ending March 2012 and 2022
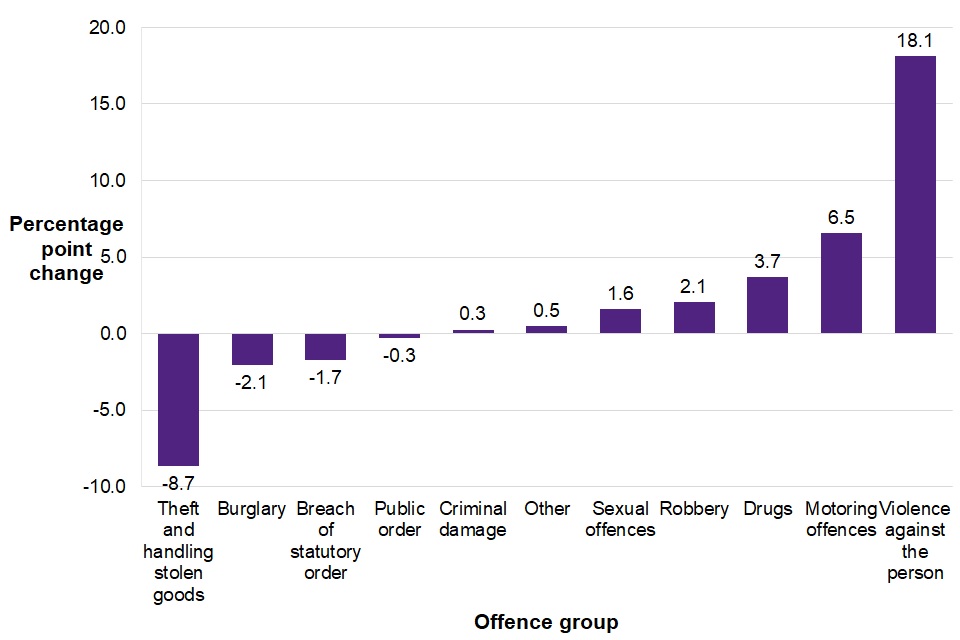
Whilst the number of proven offences committed by children has fallen for all crime types when compared with ten years ago, the proportions of these offence groups has been changing (Figure 4.2). Violence against the person offences have seen the greatest increase in proportion, gradually increasing from 17% in the year ending March 2012 to 35% of proven offences in the latest year.
Theft and handling stolen goods offences have seen the largest proportional decrease in the last ten years, falling by over half from 15% in the year ending March 2012 to 7% in the latest year.
4.2 Offence group by gravity score
Figure 4.3: Proven offences by children, by offence group and gravity score band, England and Wales, year ending March 2022
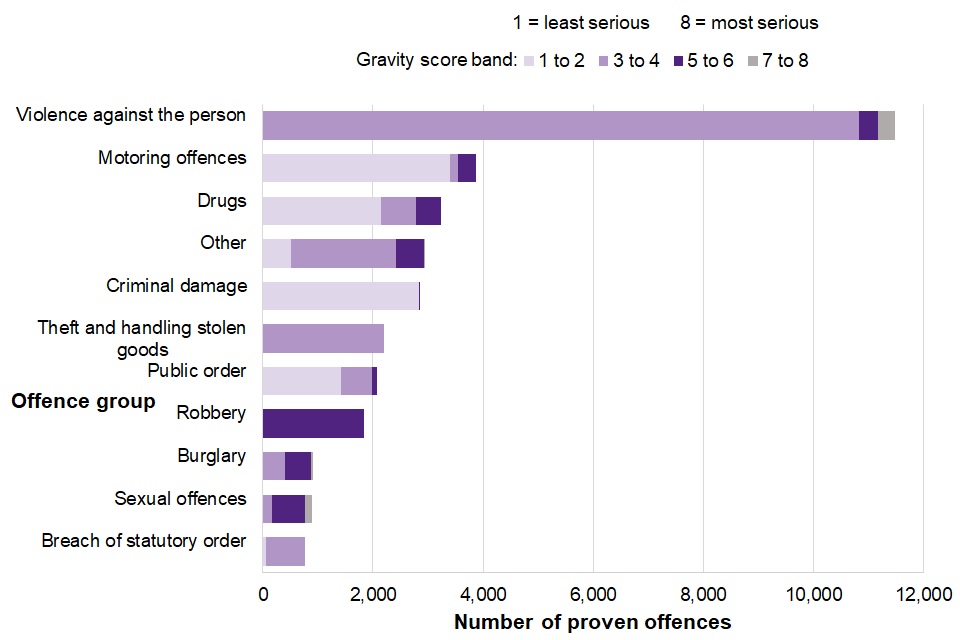
An offence’s gravity score is scored out of eight, ranging from one (less serious) up to eight (most serious). For example, non-payment of travel fare has a gravity score of 1 while murder has a gravity score of 8.
Figure 4.3 shows that the violence against the person offence group made up the largest share of offences in the year ending March 2022. Only a small proportion of offences (6%) within this group had a higher gravity score of five to eight. For robbery, burglary and sexual offences, the majority of offences had a higher gravity score of five to eight (100%, 57% and 82% respectively).
In the latest year, around 190 proven offences committed by children had the highest gravity score of eight, which accounted for 1% of all proven offences. The majority of these offences were sexual offences (59%) (Supplementary Table 4.4).
Figure 4.4: Proportion of proven offences by gravity score band and demographic characteristics, England and Wales, year ending March 2022
| Gravity Score 1 to 4 (Less Serious) | Gravity Score 5 to 8 (Most Serious) | ||
| Age | 10 to 14 | 88% | 12% |
| Age | 15 to 17 | 84% | 16% |
| Ethnicity | Asian | 82% | 18% |
| Ethnicity | Black | 74% | 26% |
| Ethnicity | Mixed | 81% | 19% |
| Ethnicity | Other | 74% | 26% |
| Ethnicity | White | 87% | 13% |
| Sex | Girls | 94% | 6% |
| Sex | Boys | 83% | 17% |
Figure 4.4 shows that the proportion of proven offences with a gravity score in the higher band of five to eight, was greater for:
those aged 15 to 17 (16% compared to 12% of offences committed by 10 to 14 year olds),
Black children and Other children (both 26%, with the other ethnic groups ranging from 13% to 19%), and
boys (17%, compared to 6% for girls).
4.3 Knife or offensive weapon offences committed by children
Figure 4.5: Knife or offensive weapon offences committed by children, resulting in a caution or sentence, England and Wales, years ending March 2012 to 2022
This section covers offences for which children received cautions or sentences for possession of an article with a blade or point, possession of an offensive weapon, or threatening with either type of weapon. In the year ending March 2022, there were just under 3,500 knife or offensive weapon offences committed by children resulting in a caution or sentence, which is 2% lower than the previous year and 3% lower than ten years ago. This is the fourth consecutive year on year decrease.
In the latest year, the majority (97%) of knife or offensive weapon offences committed by children were possession offences and the remaining 3% were threatening with a knife or offensive weapon offences. These proportions have remained broadly stable over the last nine years[footnote 15] (Supplementary Table 4.7a and 4.7b).
Supplementary Table 4.7 shows that in the year ending March 2022, just over half (51%) of disposals given to children for a knife or offensive weapon offence were a community sentence. This proportion is broadly stable over the last ten years.
The proportion of children sentenced to immediate custody for knife and offensive weapon offences decreased from 8% to 6% in the last year, which is the lowest proportion seen across the last ten years.
5. Sentencing of children
In the year ending March 2022:
There were just under 11,400 occasions where children were sentenced at court, which is 7% lower than the previous year. This continues the decreases seen in each of the last ten years.
The average time from offence to completion was 217 days, the second highest in the time series and just four days lower than the previous year and well above pre-pandemic levels. This is also reflected across the adult system.
Of all sentencing occasions for indictable offences, the proportion[footnote 16] of sentencing occasions involving Black children for indictable offences decreased from 21% in the year ending March 2017 to 20% in the latest year.
The average custodial sentence length for all offences has increased by six months compared with the previous year to 22.8 months. This increase may have been due to a small number of cases which impacted on the overall average.
This chapter focuses on trends of children proceeded against at court, time taken from offence to completion at court and sentences received at court by children by type of sentence and court.
5.1 Children proceeded against
Figure 5.1: Children proceeded against at court, England and Wales, years ending March 2012 to 2022
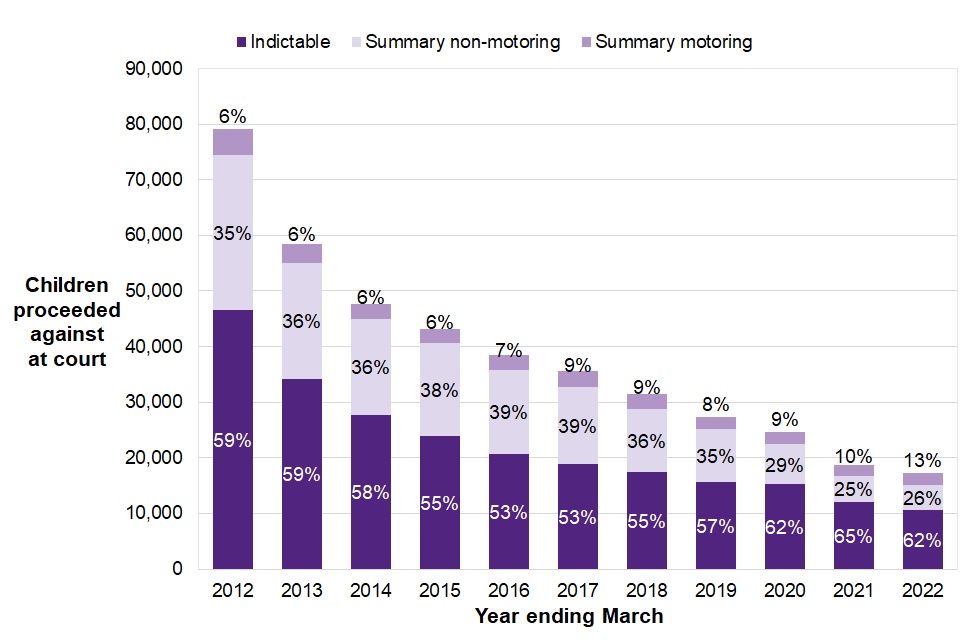
There were around 17,200 children proceeded against at court in the year ending March 2022, a fall of 8% in the latest year and a fall of 78% compared to ten years ago. Almost two thirds (62%) of these proceedings were for indictable offences , 26% were for summary non-motoring offences and the remaining 13% were for summary motoring offences (Supplementary Table 5.1).
5.2 Average time from offence to completion at court
Figure 5.2: Average time from offence to completion at court, England and Wales, years ending March 2012 to 2022
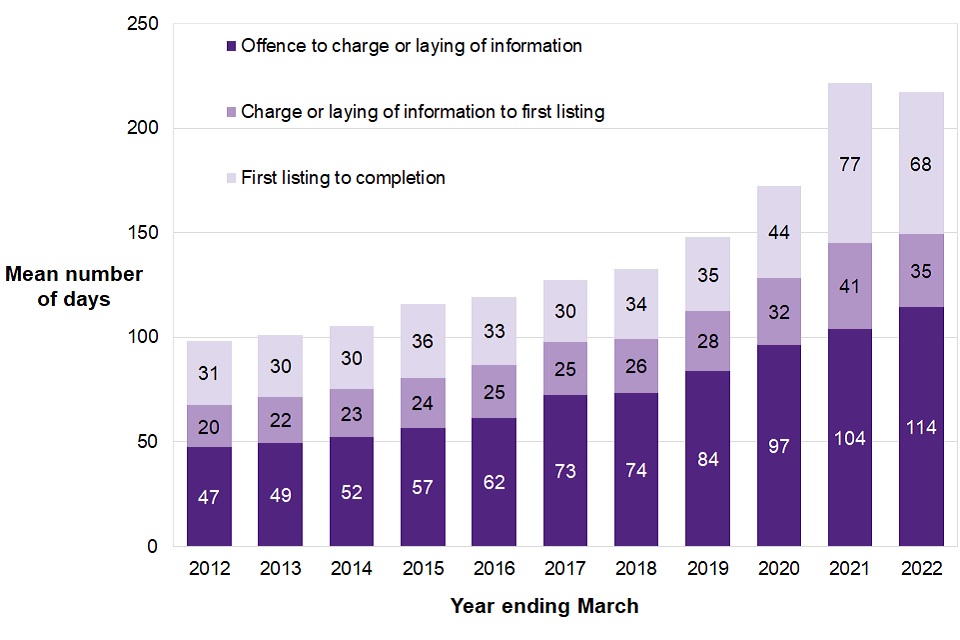
Figure 5.2 shows the average (mean) number of days taken from the day of the offence or alleged offence to the day the case was concluded at court with the child being found guilty or acquitted.
In the year ending March 2022, the average time from offence to completion was 217 days, compared with 221 days in the previous year and 98 days in the year ending March 2012.
While the average time for offence to completion saw a decrease for the first time in the last ten years, it was 121% higher than in the year ending March 2012, the second highest figure in the time series, and well above pre-pandemic levels. This is also reflected across the adult system, as evidenced in the Criminal Court Statistics.
Figure 5.2 shows that the average days for:
offence to charge or laying of information increased by ten days (10%) to 114 days;
charge or laying of information to first listing decreased by six days (15%) to 35 days; and
first listing to completion decreased by nine days (11%) to 68 days.
The average time from first listing to completion was between 31 days and 44 days in the years ending March 2011 to 2020 and rose to 77 days in the year ending March 2021 before falling to 68 days in the latest year, which is well above pre-pandemic levels.
5.3 Sentencing of children in all courts
Figure 5.3: Number of sentencing occasions of children in all courts by sentence type, England and Wales, years ending March 2012 to 2022
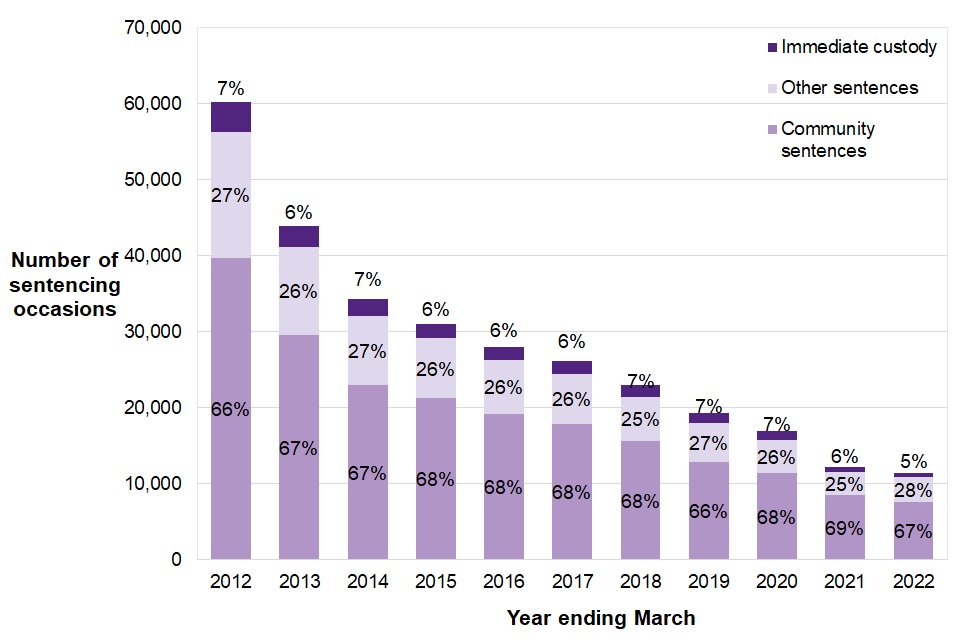
There were just under 11,400 occasions where children were sentenced in all courts in the latest year, which is 7% lower than the previous year and 81% lower than the year ending March 2012. There have been year-on-year falls in the number of sentencing occasions of children over the last ten years.
The number of custodial sentences has decreased in each of the last ten years. There were around 550 custodial sentences given in the year ending March 2022, compared with around 670 in the previous year (a decrease of 18%) and compared with around 4,000 ten years ago (a decrease of 86%).
As Figure 5.3 shows, the proportion of custodial sentences has remained broadly stable, varying between 6% and 7% of total sentences over this period between the years ending March 2012 to March 2021 and falling to 5% of total sentences in the latest year.
Supplementary Table 5.4 shows that in the year ending March 2022, of the 11,400 sentencing occasions of children for all types of offences in all courts there were:
around 550 sentences to immediate custody (5% of all sentences);
around 7,700 community sentences (67% of all sentences); and
just under 3,200 other types of sentences (28% of all sentences). These include absolute and conditional discharges, fines and other less common disposals.
5.4 Sentencing of children by court type
Figure 5.4: Number and proportion of sentencing occasions of children by court type[footnote 17], England and Wales, years ending March 2012 to 2022
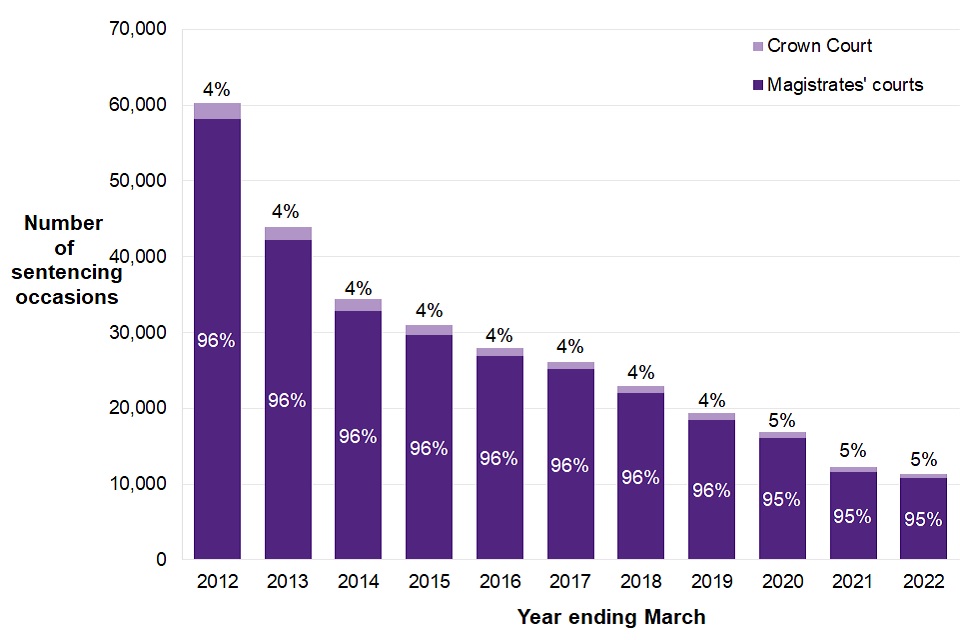
Depending on the seriousness of the offence, cases will either be heard in a magistrates’ court from start to finish or will be referred from a magistrates’ court to the Crown Court. The Crown Court only hears cases involving more serious offences, so a much smaller number of children are sentenced in this type of court compared with magistrates’ courts.
In the latest year, just 5% (around 520) of all sentencing occasions of children were at the Crown Court. This proportion has remained stable over the last ten years, varying between 4% and 5% (Figure 5.4).
The fact that the Crown Court tries the most serious cases is reflected in the types of sentences given. In the year ending March 2022, custodial sentences were given in 46% (around 240) of the 520 sentencing occasions of children at the Crown Court. This compares to just 3% (around 310) of the 10,900 sentencing occasions at magistrates’ courts.
5.5 Sentencing of children at all courts by type of offence
Figure 5.5: Number of sentencing occasions of children sentenced in all courts by type of offence, England and Wales, years ending March 2012 to 2022
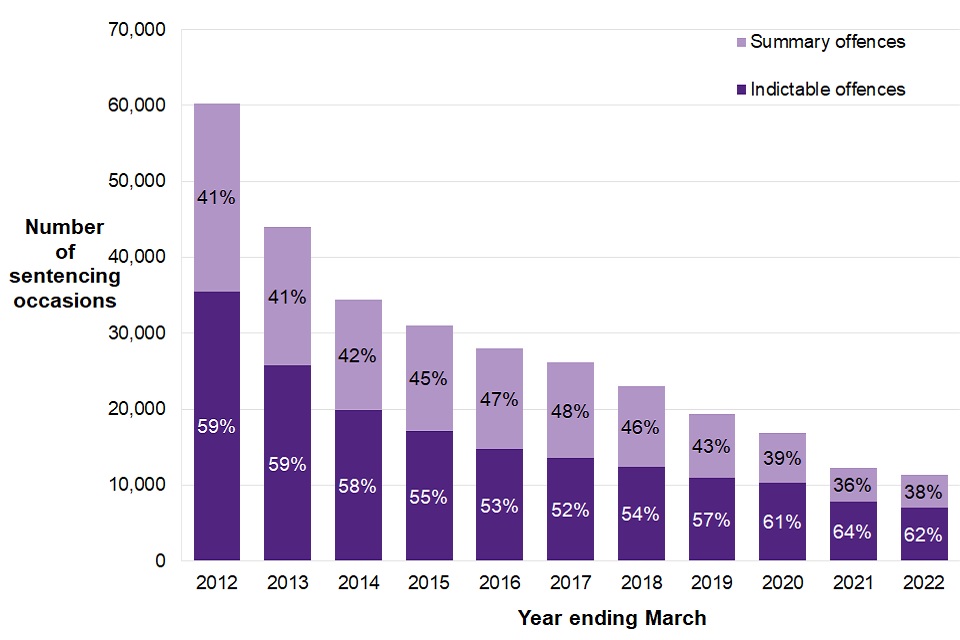
Of the 11,400 occasions in which children were sentenced in the year ending March 2022, 62% were for indictable[footnote 18] offences and 38% were for summary offences. The proportion of sentencing occasions of children for indictable offences fell compared to the previous year, following four consecutive years of proportional increases.
Of the almost 7,100 occasions on which children were sentenced for indictable offences in the latest year, 78% involved a community sentence, whereas of the 4,300 occasions in which children were sentenced for summary offences, 49% involved a community sentence.
In the year ending March 2022, 7% of the occasions in which children were sentenced for indictable offences involved a sentence to immediate custody, compared with 1% for summary offences (Supplementary Tables 5.4a and 5.4b).
5.6 Sentencing of children for indictable offences by ethnicity[footnote 19][footnote 20]
Figure 5.6: Number of sentencing occasions of children sentenced for indictable offences by ethnicity, England and Wales, years ending March 2017 to 2022
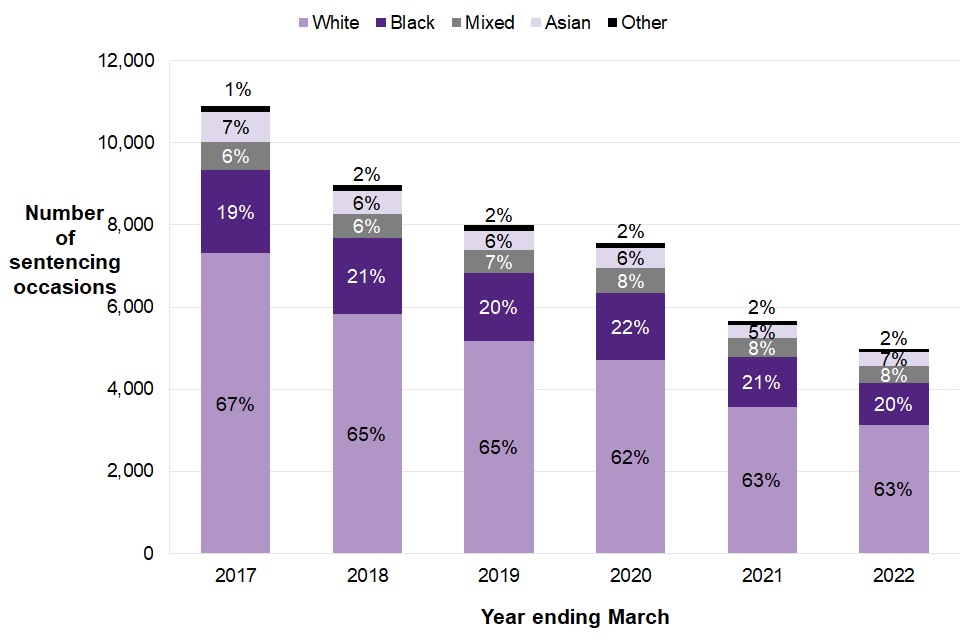
In the year ending March 2022, the number of occasions on which children were sentenced at court for indictable offences varied by ethnicity[footnote 21]. In the latest year there were:
around 3,100 sentencing occasions for White children;
just over 1,000 sentencing occasions for Black children;
410 sentencing occasions for Mixed children;
just under 330 sentencing occasions for Asian children; and
around 90 sentencing occasion for Other children.
Over the last five years, there have been decreases in the number of occasions in which children of each ethnicity group have been sentenced at court for indictable offences. The decrease in sentencing occasions for White children has been at a higher rate than for those in other ethnic groups.
There were decreases compared with the previous year in the number of occasions on which children were sentenced at court for indictable offences across four of the five ethnicity groups. The biggest decrease of 16% was for Black children, while Mixed, Other and White children each decreased by 12%. There was an increase of 9% for Asian children.
5.7 Average custodial sentence length[footnote 22]
Figure 5.7: Average custodial sentence length in months by type of offence, England and Wales, years ending March 2012 to 2022
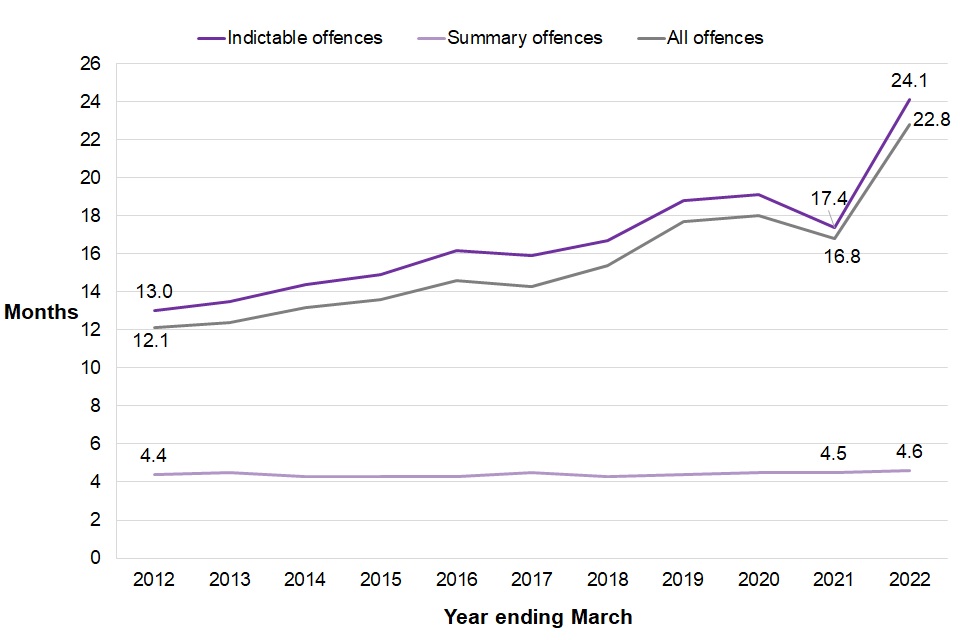
For children sentenced to custody, the average custodial sentence length varied based on the type of offence the child was sentenced for. In the latest year, the average custodial sentence length was:
22.8 months for all offences;
24.1 months for indictable offences; and
4.6 months for summary offences.
The average custodial sentence length for all offences has increased by six months compared with the previous year to 22.8 months. This increase may have been due to a small number of cases which impacted on the overall average.
The average custodial sentence length for indictable offences increased by almost seven months compared to the previous year, the biggest year on year change in the time series. Between the years ending March 2012 and March 2021, the average custodial sentence length for indictable offences increased by over four months.
For summary offences, the average custodial sentence length has remained broadly stable over the last ten years ranging from 4.3 months to 4.6 months.
6. Use of remand for children
In the year ending March 2022:
Almost three quarters (73%) of children remanded to youth detention accommodation did not subsequently receive a custodial sentence, which is the joint highest in the time series along with the previous year.
The average number of children held on remand accounted for 45% of all children in youth custody, the largest proportion in the last ten years and five percentage points higher than the previous year.
There were around 10,500 remand episodes of which the majority (79%) were bail remands, with youth detention accommodation remands accounting for 11%, and the remaining 9% being community remands with intervention.
This chapter presents data on trends of use of remand for children aged 10 to 17, characteristics of the custodial remand population and the outcomes for children following custodial remand. There has been a change to the counting rules for the types of remand given to children. Please see the Guide to Youth Justice Statistics for further details.
6.1 Types of remand given to children
Figure 6.1: Type of remand given to children, England and Wales, years ending March 2018 to 2022
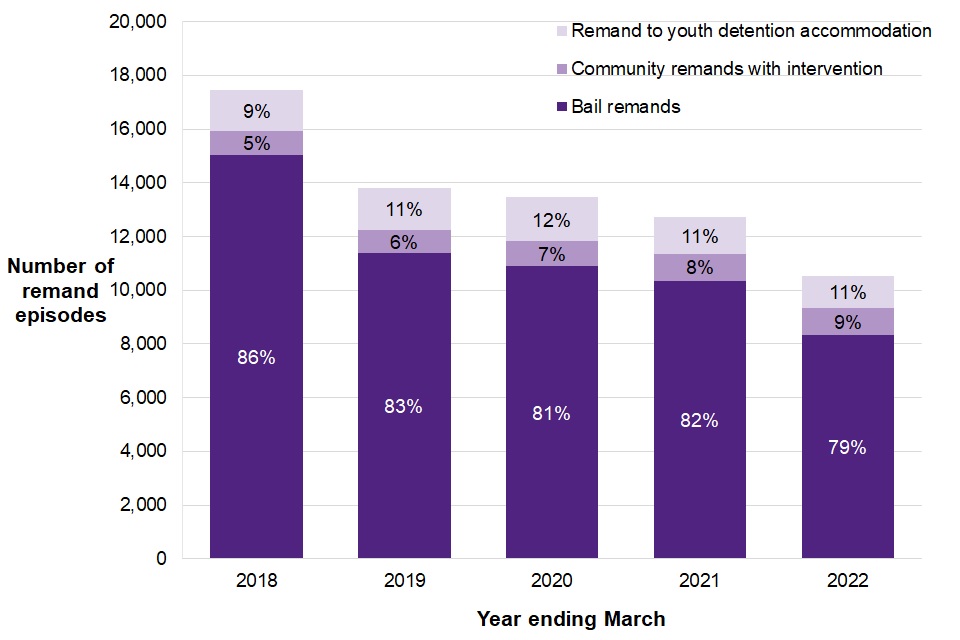
This data shows the number of remand decisions made for outcomes occurring in each year. There has been a change of counting rules this year, whereby only the most restrictive remand decision applied to the most serious unique outcome on a given day during the court proceeding is counted.
There were around 10,500 remands given to children in the year ending March 2022, of which:
the majority (79%) were bail remands;
11% were remands to youth detention accommodation; and
the remaining 9% were community remands with intervention.
There was a 17% fall in the number of remand episodes compared to the previous year. This was driven by decreases in Bail Remands which decreased by 20% and Remands to Youth Detention Accommodation which decreased by 11%. Community Remands with Intervention saw no change compared with the previous year.
For remands given in the year ending March 2022, the breakdown of demographics (Supplementary Table 6.1) shows:
most episodes (90%) involved boys;
the majority (87%) involved children aged 15 to 17; and
most episodes were given to White children (61%), while Black children and Mixed children were the next highest (18% and 12% respectively)[footnote 23].
6.2 Average monthly population of children on remand in youth custody
Figure 6.2: Average monthly population of children on remand in youth custody, youth secure estate in England and Wales, years ending March 2012 to 2022

There was an average monthly population of around 210 children remanded in youth custody at any one time in the year ending March 2022, which was 8% lower than the previous year and 57% lower than ten years ago.
Children remanded in youth custody accounted for 45% of the average youth custody population in the latest year, an increase from 40% in the previous year. This is the highest proportion seen in the last ten years and likely due in part to an increase in the amount of time children are spending in custody on remand with a median number of 68 days compared with 59 days in the previous year and 43 days in the year ending March 2020 (see table 7.27 in the ‘Ch7 – Children in youth custody’ supplementary tables).
While there was a year on year decrease in the remand population, the sentenced population decreased at a greater rate. Prior to the year ending March 2021, the proportion of the total custody population that children remanded to youth custody comprised had fluctuated between 21% and 31%.
Supplementary Tables 6.3 and 6.4 show that for children remanded in youth custody, the majority were:
in a Young Offender Institution (70%);
boys (97%), a proportion which has remained broadly stable over the last ten years);
from an ethnic minority group (58%); and
aged 17 (50%), a decrease from 60% in the previous year.
See Chapter 7 for information on the length of time children spent in youth custody on remand.
Figure 6.3: Proportion of children in youth custody on remand by ethnicity[footnote 24], youth secure estate in England and Wales, years ending March 2012 to 2022
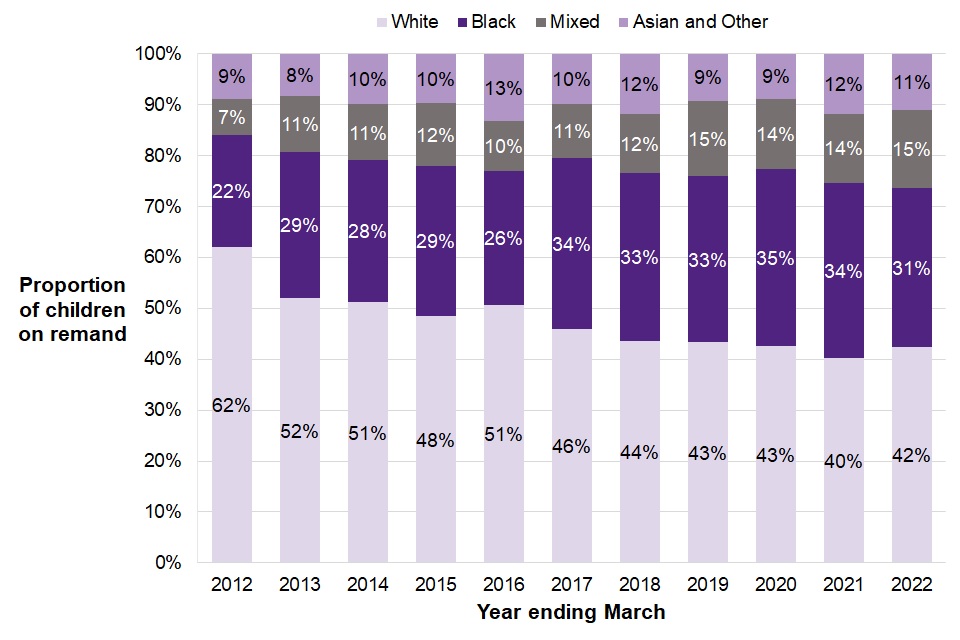
Supplementary Table 6.3 shows that in the latest year, the average number of children in custody on remand has decreased for each ethnic group, with the largest decrease being for Black children, falling by 18%.
Figure 6.3, shows that the proportion that ethnic minority groups comprised decreased slightly from 60% to 58% in the last year, though this was 20 percentage points higher than ten years ago.
Figure 6.3 also shows that:
over the last ten years the proportion of children from a White background remanded in youth custody has seen a general downward trend, falling from 62% to 42%;
children from a Mixed ethnic background accounted for 15% of those remanded in youth custody in the latest year, which is a slight increase on the previous year and more than double compared to ten years ago (7%); and
the proportion of children from an Asian or Other background fell to 11%, from 12% in the previous year. This proportion has fluctuated between 8% and 13% over the last ten years.
For more reading see ...https://www.gov.uk/government/statistics/youth-justice-statistics-2021-to-2022/youth-justice-statistics-2021-to-2022-accessible-version#:~:text=Children%20aged%2015%20to%2017,population%20in%20England%20and%20Wales.
The decline of Llandudno is really scary, it reminds me of Wrexham and Rhyl these days
ReplyDelete